
Skip to content

An international perspective

RSS

Industry news

Equipment, maintenance, oil markets and vehicle sales across different countries. We select the news and explain why it matters to station operators.

About this selection

Our summaries link to each original source. Each note distinguishes publication by Master Services from the source date; local availability and requirements must be checked for each project.

Master Services curates news for fuel-station and fleet operators. Automated relevance signals help prioritize candidates, but do not verify facts or decide publication by themselves. Automated tools also assist with research and summaries; each note follows its stated review method, links to the original source and separates reported facts from local implications. These are attributed summaries, not reporting from the scene.

Editorial illustrations accompany the notes; they do not document the reported event.

We cover petrol, diesel, hybrids and electric vehicles, including evidence that challenges our commercial assumptions. We distinguish forecasts from observed results, new registrations from the existing fleet, and international benchmarks from local pump prices.

Report an error or suggest a source

News items: 23

Illustration of storage tanks, pipelines and an oil tanker.
Conceptual illustration · Master Services.

Oil and prices

United States

Source date:

U.S. refineries exceeded 95% utilization from May through September

The EIA reported on October 22 that U.S. refineries used more than 95% of their capacity on average from May through September 2026, the highest level for those months since 1998. The agency attributes the stronger operating rates mainly to tight global distillate supplies and international demand for U.S. exports. Utilization fell from summer levels during the first three weeks of October but remained above the 2021–2025 seasonal average.

Why it may matter: High utilization does not necessarily mean record output. According to the EIA, U.S. refining capacity has fallen 4% since 2019, so output was the highest since 2019 even as utilization reached its highest level since 1998. Tracking fuel supply therefore calls for reading capacity, output and distillate demand together. These figures describe observed U.S. operations; they are neither a forecast nor a determination of retail fuel prices in Panama.

Automated curation · Source: U.S. Energy Information Administration (EIA)

Published by Master Services:

Illustration of cars and a van beside charging and fueling infrastructure.
Conceptual illustration · Master Services.

Mobility and vehicle sales

European Union

Source date:

ACEA: battery-electric cars reach 22.7% of new EU registrations through September

From January through September 2026, the EU registered 8,517,059 new passenger cars, up 5.7% year on year, according to ACEA. Battery-electric cars accounted for 1,931,465 units and 22.7% of the market; non-plug-in hybrids for 3,090,530 and 36.3%; and plug-in hybrids for 860,257 and 10.1%. Registrations in the petrol and diesel categories fell 19.1% and 19.5%, respectively, leaving shares of 21.2% and 7.1%. The report was published on October 22.

Why it may matter: ACEA’s hybrid category includes full and mild hybrids and remains separate from battery-electric and plug-in hybrid cars. For station and fleet operators, these figures help track the mix of new EU vehicles, but do not measure the existing vehicle fleet or fuel consumption. These are provisional EU data, not figures for all of Europe or Panama. Falling petrol or diesel registrations alone cannot quantify a decline in fuel demand at service stations.

Automated curation · Source: Asociación Europea de Fabricantes de Automóviles (ACEA)

Published by Master Services:

Illustration of storage tanks, pipelines and an oil tanker.
Conceptual illustration · Master Services.

Oil and prices

Shipping routes from the Middle East Gulf to Asia

Source date:

IEA: Gulf-to-Asia crude freight exceeded US$37 per barrel in mid-October

The International Energy Agency reported on October 21 that shipping crude from the Middle East Gulf to Asia on large tankers cost over US$37 per barrel in mid-month, more than five times the pre-conflict level. For refined products, Gulf-to-Japan freight on LR1 tankers was nearly US$27 per barrel. These are reported transport costs for those routes.

Why it may matter: When comparing supply quotations, stations and fleets can ask suppliers to identify the product, origin, destination, date, unit and included charges. This helps distinguish changes in fuel costs from changes in transport costs. Applying these rates to Panama would require evidence about the actual route and local contract; this note cannot establish a pump-price adjustment.

Automated curation · Source: International Energy Agency (IEA)

Published by Master Services:

Illustration of storage tanks, pipelines and an oil tanker.
Conceptual illustration · Master Services.

Oil and prices

International benchmark: Brent

Source date:

EIA: Brent spot fell to US$119.33 per barrel on October 16

The Brent spot price moved from US$130.18 per barrel on October 8 to US$119.33 on Friday, October 16, 2026, according to Table 11 of the EIA weekly report released on October 21. These are daily observations: US$119.33 is not that week’s average. The same table records a monthly average of US$114.16 in September, compared with US$91.08 in August.

Why it may matter: When reading supply references, keep each figure’s time period explicit: daily observations allow a comparison between two dates, while a monthly average summarizes a different interval. The decline from October 8 to October 16 does not by itself establish a future trend. Brent is also a crude-oil benchmark, not a finished gasoline or diesel price or a retail pump price in Panama. This note uses the archived October 21 edition so that the link preserves the table consulted when the current report changes.

Automated curation · Source: U.S. Energy Information Administration (EIA)

Published by Master Services:
Illustration of cars and a van beside charging and fueling infrastructure.
Conceptual illustration · Master Services.

Mobility and vehicle sales

United States

Source date:

EIA: hybrids reach 16% of new U.S. vehicle sales; battery-electric vehicles account for 6%

In the third quarter of 2026, non-plug-in hybrids represented 16% of new light-duty vehicle sales in the United States. Battery-electric vehicles accounted for 6%, compared with 10% a year earlier; plug-in hybrids fell from 1.8% to 0.7%. EIA published these Omdia estimates on October 19. These are shares of new sales, not of the vehicles already on the road.

Why it may matter: For stations and fleets, a useful comparison starts with customers’ own vehicle purchases, separating non-plug-in hybrids, plug-in hybrids and battery-electric vehicles. Estimating fuel volumes or charging needs also requires mileage, use patterns and the size of the fleet served. The publication does not supply those inputs for Panama; a decline in sales share cannot be converted into an equivalent increase in petrol demand.

Automated curation · Source: U.S. Energy Information Administration (EIA), con estimaciones de Omdia

Published by Master Services:

Illustration of storage tanks, pipelines and an oil tanker.
Conceptual illustration · Master Services.

Oil and prices

Global market

Source date:

IEA reports 330 million barrels released and agrees to accelerate outstanding diesel releases

On October 15, the IEA Governing Board reported approximately 330 million barrels released under the March 2026 collective action. It agreed to accelerate roughly 100 million barrels still outstanding, with plans including over 20 million barrels of diesel. These remaining volumes are commitments, not completed deliveries.

Why it may matter: For stations and fleets, released stocks should be distinguished from volumes still due to reach the market: the announced diesel is part of outstanding commitments. The statement gives no country-by-country timetable and does not establish availability or pump prices in Panama.

Automated curation · Source: IEA

Published by Master Services:

Illustration of storage tanks, pipelines and an oil tanker.
Conceptual illustration · Master Services.

Oil and prices

Global market

Source date:

IEA: physical crude averaged US$116.89 in September as diesel supply remained tight

The October 14 report puts September’s North Sea Dated average at US$116.89 per barrel, up US$26.17 from August. Global diesel exports were 700,000 barrels per day below a year earlier. The IEA forecasts a 2.6-million-barrel-per-day decline in global oil demand in 2026.

Why it may matter: Fleet price comparisons should identify product, market, period and unit. This observed international average and the consumption forecast serve different purposes; neither alone determines pump prices in Panama.

Automated curation · Source: IEA

Published by Master Services:

Illustration of cars and a van beside charging and fueling infrastructure.
Conceptual illustration · Master Services.

Mobility and vehicle sales

Global

Source date:

Global new-car registrations fell 4.9% in the first half of 2026; South America grew 16.9%

ACEA estimates 35.7 million new passenger-car registrations worldwide in the first half of 2026, down 4.9% year on year.

Why it may matter: Assessing demand at a station in Panama requires comparable local data: new-vehicle registrations show additions, the active fleet describes existing vehicles, and fuel sales measure volume dispensed. Each series needs a consistent period, area and vehicle category. This international report alone cannot quantify a future rise or fall in local gasoline or diesel consumption.

Automated curation · Source: ACEA

Published by Master Services:

Illustration of storage tanks, pipelines and an oil tanker.
Conceptual illustration · Master Services.

Oil and prices

Global market

Source date:

IEA reported 325 million barrels released and support for prioritising diesel

In its October 7 statement, the IEA reported that approximately 325 million barrels had been released under the March 2026 collective action. Member governments supported accelerating outstanding commitments and prioritising diesel where possible.

Why it may matter: The reported barrels are a cumulative volume, not a daily delivery rate. For stations and fleets, this dated update distinguishes released stocks from outstanding commitments; it does not establish local availability or determine Panama’s pump prices.

Automated curation · Source: IEA

Published by Master Services:

Illustration of storage tanks, pipelines and an oil tanker.
Conceptual illustration · Master Services.

Oil and prices

United States

Source date:

EIA forecasts higher U.S. heating-oil spending this winter

On October 7, EIA forecast a 21% rise in spending by U.S. households using heating oil compared with the previous winter. It expects fourth-quarter distillate inventories to be 11% below the five-year average.

Why it may matter: These are U.S. heating and inventory forecasts. They provide distillate-market context, without estimating road-diesel sales, Panamanian demand or local pump prices.

Automated curation · Source: U.S. Energy Information Administration (EIA)

Published by Master Services:
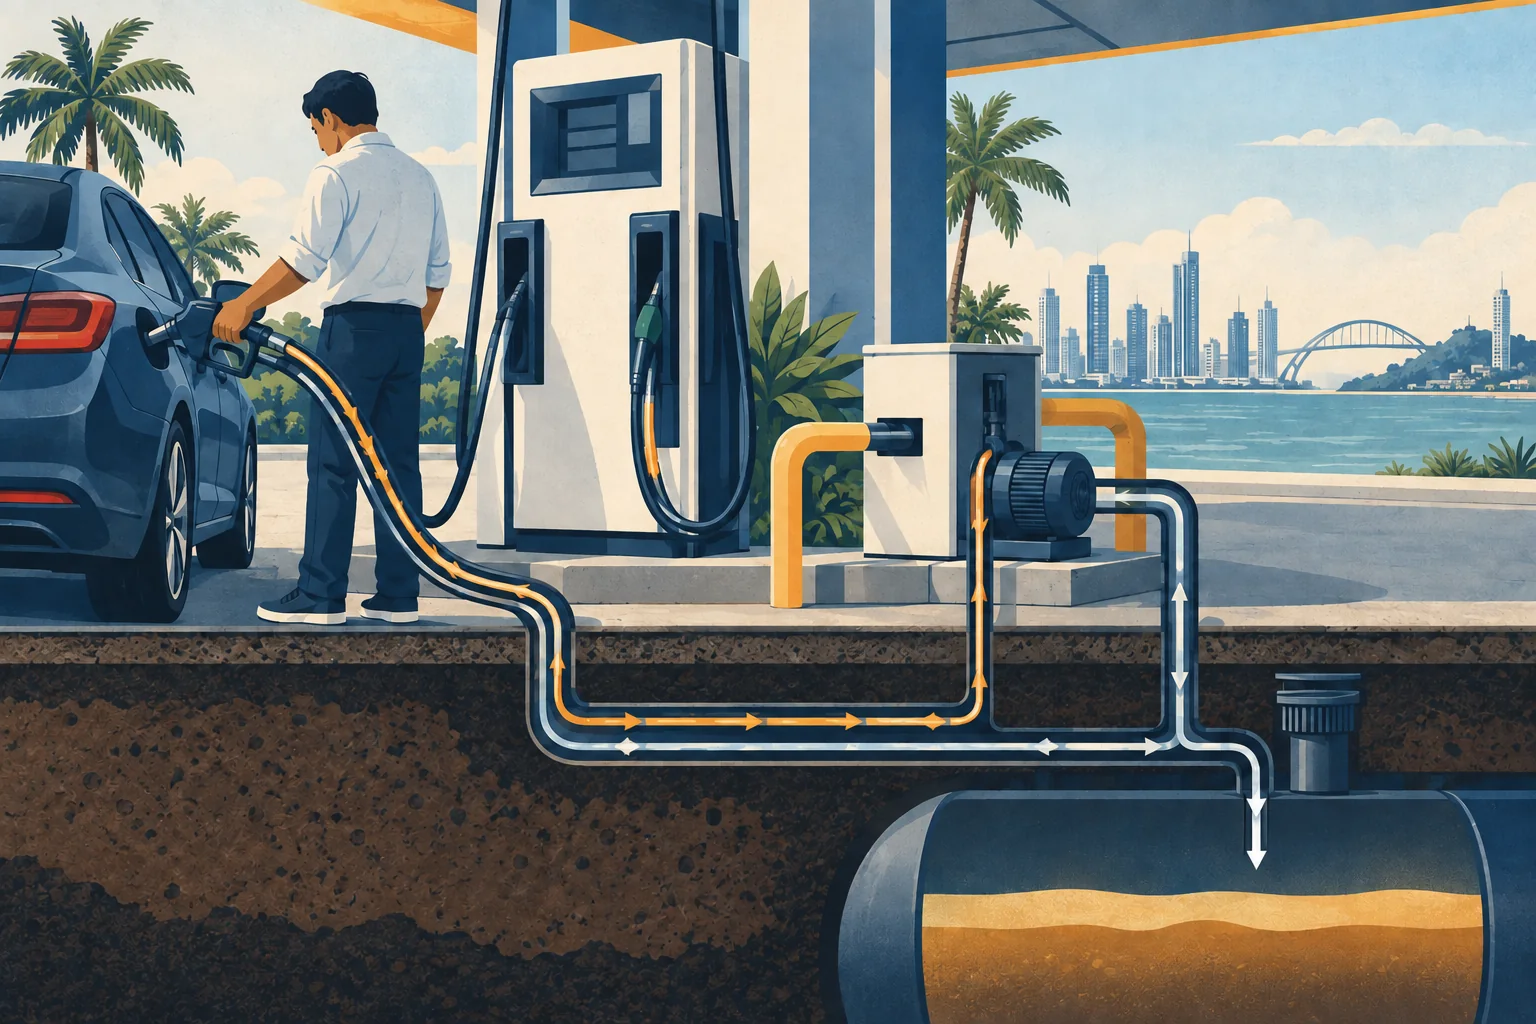
Illustration of storage tanks, pipelines and an oil tanker.
Conceptual illustration · Master Services.

Oil and prices

United States and Europe

Source date:

New York diesel spot prices averaged US$4.956 per gallon in September

The EIA table released on October 7 reports September 2026 New York ultra-low-sulfur diesel at US$4.956 per gallon, up 16.5% from US$4.253 in August. Brent averaged US$114.16 per barrel and WTI US$97.31.

Why it may matter: These are averages of daily spot closing prices, not pump prices or forecasts. Diesel and crude references use different units; these figures do not determine Panama’s next fuel-price adjustment.

Automated curation · Source: U.S. Energy Information Administration (EIA)

Published by Master Services:
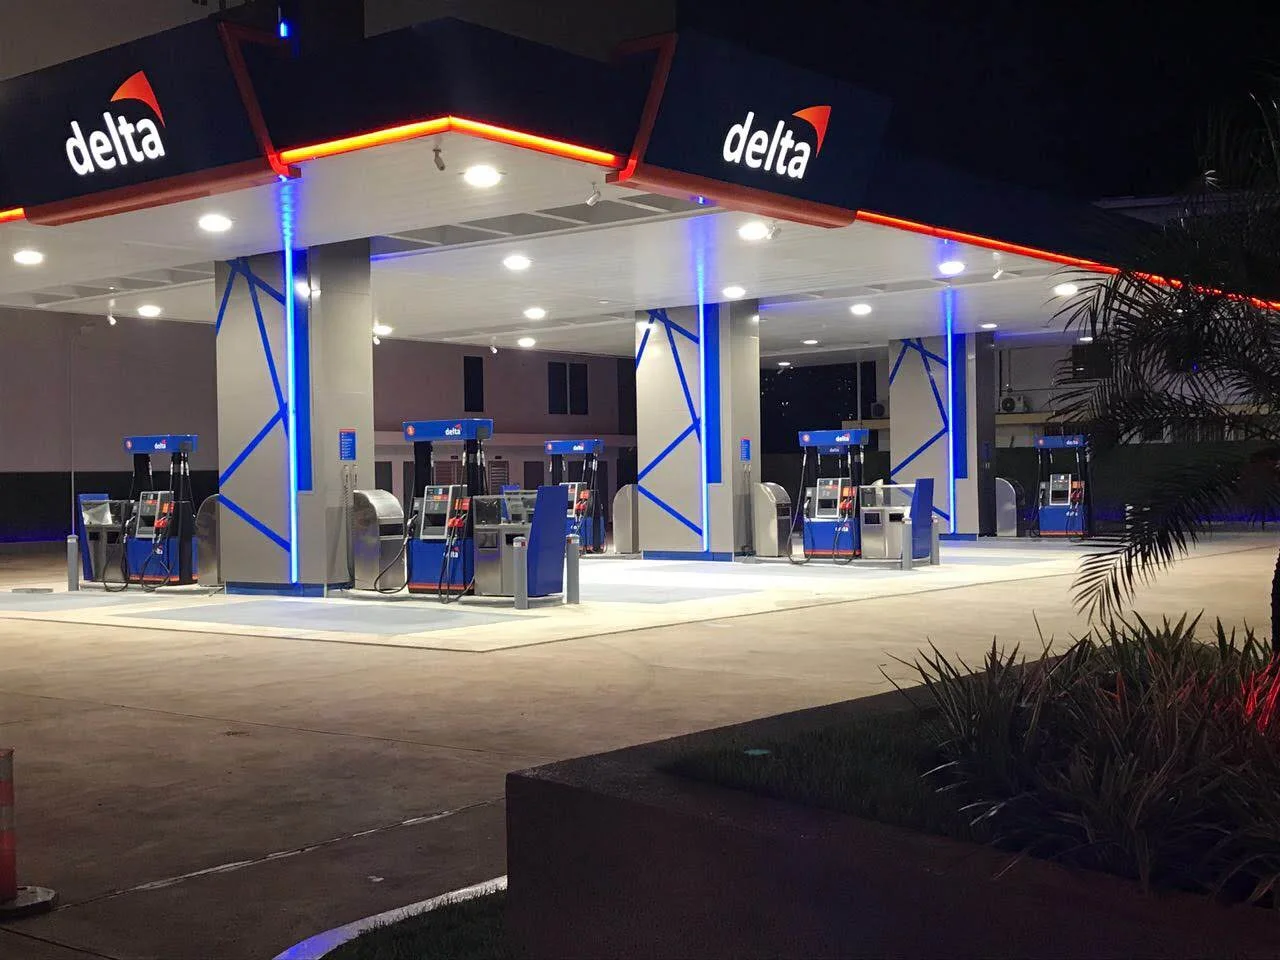
Illustration of storage tanks, pipelines and an oil tanker.
Conceptual illustration · Master Services.

Oil and prices

Global Brent market / U.S. refining

Source date:

Brent and refining margins rose in the third quarter of 2026

Front-month Brent futures reached US$109 per barrel on September 15; spot prices reached US$132 around that time. EIA reports that the quarterly average gasoline refining margin more than doubled its year-earlier level; distillate and jet fuel margins nearly tripled.

Why it may matter: A refining margin is not a station margin. These observed prices are neither a forecast nor a consumer fuel price in Panama.

Automated curation · Source: U.S. Energy Information Administration (EIA)

Published by Master Services:

Illustration of storage tanks, pipelines and an oil tanker.
Conceptual illustration · Master Services.

Oil and prices

United States / Panama Canal trade route

Source date:

U.S. propane exports grew 11% in the first half of 2026

EIA reports U.S. propane exports of 2 million barrels per day in January–June 2026, up 11% from a year earlier. In April, exports reached 2.1 million barrels per day. The report says water constraints at the Panama Canal raise transport costs and may limit that trade.

Why it may matter: These are LPG trade figures, distinct from crude oil and diesel. EIA does not quantify an impact on fuel prices in Panama.

Automated curation · Source: U.S. Energy Information Administration (EIA)

Published by Master Services:

Illustration of cars and a van beside charging and fueling infrastructure.
Conceptual illustration · Master Services.

Mobility and vehicle sales

United States

Source date:

U.S. vehicle electricity use grew 8% between half-years, at a slower pace

EIA estimates light-duty electric vehicles used 8% more electricity in January–June 2026 than in July–December 2025. The calculation includes battery-electric and plug-in hybrid vehicles; previous half-year growth ranged from 13% to 24%.

Why it may matter: Consumption continues to grow, more slowly. These are modeled U.S. electricity-use estimates, not sales or a share of Panama’s vehicle fleet. They do not establish local gasoline or diesel demand.

Automated curation · Source: U.S. Energy Information Administration (EIA)

Published by Master Services:

Illustration of cars and a van beside charging and fueling infrastructure.
Conceptual illustration · Master Services.

Mobility and vehicle sales

European Union

Source date:

Hybrids lead new EU registrations as battery-electric cars reach 21.7%

ACEA reported 7,546,397 new passenger-car registrations in the European Union from January through August 2026. Full and mild hybrids represented 36.6%, battery-electric cars 21.7% and plug-in hybrids 10.0%. The petrol and diesel categories accounted for 21.7% and 7.3%, respectively.

Why it may matter: Full and mild hybrids are not exclusively electric vehicles. When assessing station demand, new-registration shares must be distinguished from the existing fleet, mileage and fuel use per vehicle. These figures describe the EU and do not automatically describe Panama’s market.

Reviewed selection · Source: ACEA

Published by Master Services:

Conceptual illustration of a technician checking an unbranded fuel-nozzle holder.
Conceptual illustration · Master Services.

Maintenance

North America

Source date:

Freedom Electronics redesigns the nozzle boot for Wayne Ovation and Anthem

Freedom Electronics presented a redesigned nozzle boot for Wayne Ovation and Anthem dispensers. According to the supplier, changes to the shaft and bushings address pin bending and mechanism misalignment.

Why it may matter: A useful reference for maintenance teams assessing wear or nozzle-detection issues. Before selecting a replacement, check the part number and compatibility with the installed dispenser.

Reviewed selection · Source: Freedom Electronics

Published by Master Services:

Illustration of storage tanks, pipelines and an oil tanker.
Conceptual illustration · Master Services.

Oil and prices

United States: contiguous 48 states

Source date:

Publicly traded companies produce 68% of oil and gas in the contiguous United States

The EIA’s September 22 analysis says publicly traded companies represented 2% of approximately 12,000 U.S. producers in 2025 and supplied 68% of combined oil and gas production in the contiguous 48 states.

Why it may matter: The comparison uses barrels of oil equivalent and excludes Alaska and Hawaii. It describes extraction, not service-station market share. The EIA identifies Enverus as its data source.

Automated curation · Source: U.S. Energy Information Administration (EIA)

Published by Master Services:

Concept illustration of a vapor-recovery hose returning captured vapor from a dispenser to the tank headspace.
Conceptual illustration · Master Services.

Environment

Middle East and Africa

Source date:

Gilbarco MEA highlights VaporTEK for vapour recovery

Gilbarco Veeder-Root MEA shared an update on VaporTEK and its role in vapour recovery at fuel stations. The post highlights system performance and efficiency; it does not announce a launch date or availability in Panama.

Why it may matter: Equipment selection requires checking the dispenser model, station configuration and applicable technical documentation.

Reviewed selection · Source: Gilbarco Veeder-Root MEA

Published by Master Services:

Illustration of storage tanks, pipelines and an oil tanker.
Conceptual illustration · Master Services.

Oil and prices

United States

Source date:

EIA explains the drivers of diesel prices in the United States

EIA reported on September 18 that average U.S. retail diesel cost US$6.29 per gallon on September 14. Its analysis separates crude oil, refining, distribution, margins and taxes.

Why it may matter: This is a dated U.S. benchmark, not a current Panamanian price. Fleet purchasing comparisons need a consistent market, unit and date; this note does not predict the next local price change.

Automated curation · Source: U.S. Energy Information Administration (EIA)

Published by Master Services:

An illuminated fuel station from the Master Services photo archive.
Master Services archive · Context image.

Oil and prices

Panama

Source date:

Panama updated fuel prices for the 18 September–2 October period

Panama’s National Energy Secretariat announced new maximum fuel prices, effective from 6:00 a.m. on 18 September through 5:59 a.m. on 2 October 2026. Its 16 September statement reports an upward trend and provides official location-specific references in cents per litre.

Why it may matter: For a station or fleet, check the location, fuel grade and effective dates in the official table. International barrel prices and local maximum prices per litre are different measures; comparisons across different periods or units can be misleading.

Reviewed selection · Source: Secretaría Nacional de Energía de Panamá

Published by Master Services:

Concept illustration of storage tanks, pipelines, rail tank cars and road transport.
Conceptual illustration · Master Services.

Oil and prices

Global

Source date:

IEA forecasts lower global oil demand in 2026

In its September 11 report, the IEA forecasts a 2.5 million-barrel-per-day decline in global oil demand in 2026 compared with 2025. It also reports an observed inventory draw of 507 million barrels between February and August.

Why it may matter: For stations and fleets, consumption and inventories need separate analysis: falling demand does not guarantee lower prices. These global figures are not a forecast of fuel prices in Panama.

Automated curation · Source: Agencia Internacional de Energía (IEA)

Published by Master Services:

Illustration of storage tanks, pipelines and an oil tanker.
Conceptual illustration · Master Services.

Oil and prices

International market

Source date:

EIA forecasts Brent near US$90 per barrel in the second half of 2026

In its September outlook, the EIA forecasts Brent to average around US$90 per barrel in the second half of 2026 and US$74 in 2027. These projections use information available through 3 September and were released on 9 September; they are not today’s oil price.

Why it may matter: Station planning requires distinguishing crude prices, refined-fuel costs and operating margins. This international scenario can inform questions about procurement and working capital, but it does not determine Panama’s pump price per litre or guarantee higher profitability.

Reviewed selection · Source: U.S. Energy Information Administration (EIA)

Published by Master Services:

Concept illustration of an electric car, a hybrid and a van on an urban road.
Conceptual illustration · Master Services.

Mobility and vehicle sales

Colombia

Source date:

Colombia registered 4,542 new electric and 9,195 hybrid vehicles in August

ANDI and Fenalco reported 27,124 new-vehicle registrations in Colombia during August 2026, using RUNT data. Electric vehicles accounted for 4,542 and hybrids for 9,195, up 176% and 51.6% year on year, respectively. The statement does not separate plug-in from non-plug-in hybrids.

Why it may matter: This regional signal is worth tracking when studying fleets and future services. Registrations alone do not measure petrol or diesel consumption, and an aggregated hybrid category cannot establish a specific fuel reduction. A comparable local series is needed for Panama.

Reviewed selection · Source: ANDI y Fenalco / RUNT

Published by Master Services: